
Using Mind Maps for Project Risk Identification and Analysis
A risk management plan is one of the cornerstones of successful project delivery. It defines how risks are identified and managed. But even in mature project organizations, risk management often struggles with one familiar problem: fragmented information.
Risks live in spreadsheets, reports, emails, and meeting notes. Teams discuss them, score them, and file them away.
Why Mind Maps Work So Well for Risk Management Planning
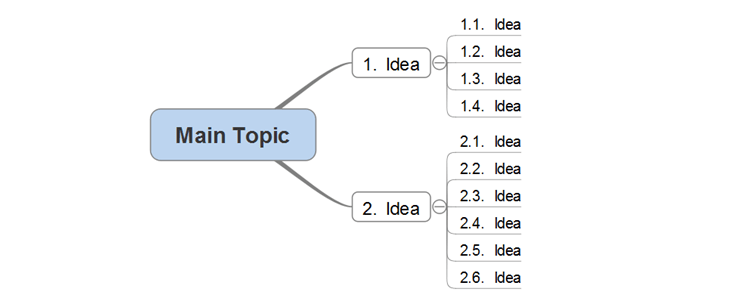
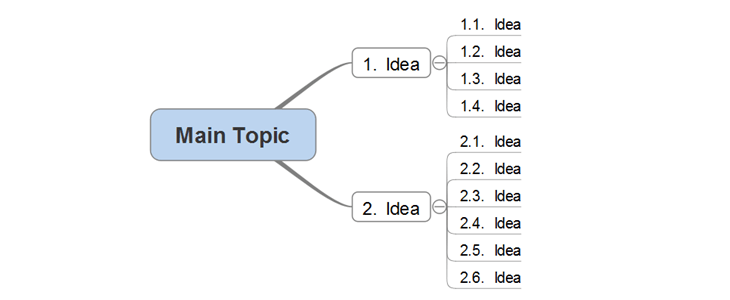
A mind map organizes information around a central theme from where connected branches expand. For risk management, the mind map structure mirrors how risks behave in real projects.
Traditional tools such as a formal risk register can be used to identify the risks and a risk management matrix to help prioritize them. Mind maps can additionally help project teams organize risks, uncover connections, and conduct more meaningful reviews throughout the project lifecycle.
They strengthen formal risk management processes by providing a visual layer that creates clarity, structure, and shared understanding across the project team. Schedule-related risks often link to resource constraints. Cost-related risks may stem from procurement delays or design uncertainty, and so on. A mind map makes these relationships visible at a glance.
For experienced project professionals, this visual clarity speeds up alignment. It improves engagement in workshops and helps stakeholders quickly grasp where the real exposure sits.
Identifying Risks More Effectively with Mind Mapping
Mind maps are particularly effective during risk identification sessions.
At the start of a project, risk identification usually receives focused attention. Workshops are held, risks are logged, and mitigation actions are defined.
Cross functional input becomes easier to manage. Engineering, planning, procurement, and project controls all contribute within the same visual framework. Risks are captured in plain language, which often improves clarity when they are later formalized in the risk register.
Visual markers can also help. Colors may indicate severity. Icons can flag new or escalating risks. These cues support engagement without adding complexity.
Structuring Risks Using Mind Maps
Mind mapping can be done digitally or on physical boards. Software tools are easier to maintain over time, while in person sessions often generate better engagement.
Both approaches work if the intent is clear. A risk mind map starts with a clear central theme, usually the project or a specific project phase. From there, the first level of branches should reflect how risks are already categorized within the organization.
At this stage, simplicity matters. The purpose is to create a flexible structure that can grow as understanding improves, not to capture every detail upfront.
A few practical guidelines help ensure value:
- Keep maps readable and focused
- Avoid excessive detail early on
- Use consistent categories and terminology
- Treat the map as a living artifact
Again, the goal is insight, not perfection.
Software like iMindQ can help you efficiently create a mind map that supports your risk management plan.
Mind maps work best as a front end to formal risk documentation. Once risks are clearly structured and discussed, transferring them into a formal risk register becomes easier and more consistent.
Risk descriptions improve. Ownership is clearer. Mitigation actions are better aligned with actual project conditions. When combined with scheduling or cost data, the result is a more realistic and actionable risk management plan.
In mature organizations, this approach improves both compliance and decision making.
Linking Mind Maps to the Risk Management Matrix
In addition, iMindQ can also help you visualize project risks with a risk management matrix.
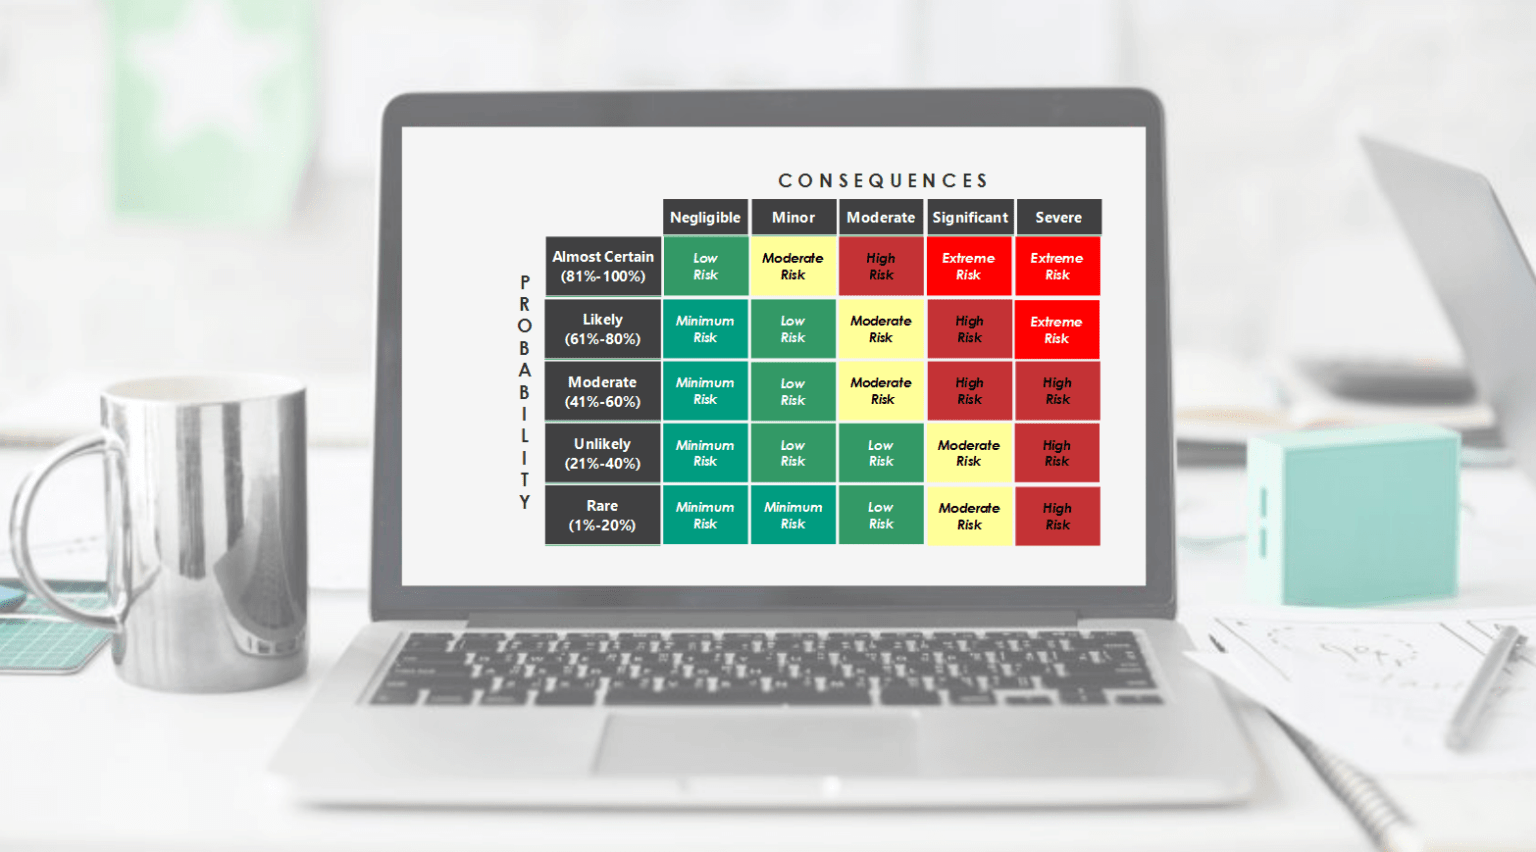
A risk management matrix template map is available for download from the official website.
In this way, iMindQ can be used as a tool to not only quickly identify and visually organize potential risks, but also to evaluate, and prioritize them further. The template follows a grid format that maps the risks likelihood (probability) against their impact (severity), helping organizations determine the risk level.
The risk levels can typically range from low to extreme, helping organizations to focus their resources on the most critical threat.
From Visual Insight to Actionable Risk Management
A strong risk management plan depends on clarity, context, and continuous engagement. While tools like the risk management matrix and register remain essential, they work best when supported by visual methods that reflect how risks interact in reality.
Mind maps offer a simple yet powerful way to organize and review project risks. They improve collaboration, highlight dependencies, and support better decision making throughout the project lifecycle.
Furthermore, mind maps are not a replacement for formal documentation. Rather, they can be practical front end to it. Once risks are clearly structured and discussed, transferring them into the risk register becomes easier and more consistent.
Mitigation actions tend to be more realistic because they are discussed in relation to other risks and project constraints. Ownership is clearer. Links to schedule activities, cost forecasts, and contingency planning are easier to establish.
In this way, mind maps enhance the effectiveness of the risk management plan.
For experienced project professionals, this approach does not add complexity. It adds perspective. And in complex projects, perspective often makes the difference.

The Synami team is the collective voice behind Synami’s project management solutions, providing guidance, tips, and industry expertise to help teams plan, manage, and deliver projects more effectively.