Professors & Educators

Plan, teach and research with visual clarity

Structure courses, explain complex topics and organize academic research with visual tools that keep ideas and relationships clear.

mind mapping

Why professors choose iMindQ

A visual approach to curriculum design, lesson planning and research that complements the way educators already work.

Curriculum planning

Structure courses, map learning objectives and organize lecture sequences with visual clarity.

Interactive presentations

Turn mind maps into visual presentations that make complex topics easier to follow.

Research organization

Map literature reviews, projects and connections between theories and methodologies.

Student collaboration

Use shared maps to facilitate group work, brainstorming and structured discussion.

From course planning to publication

Curriculum & lesson planning

  • Design complete course structures with learning outcomes, weekly topics and assessment milestones mapped visually
  • Create modular lesson plans that can be adapted for different class formats or student levels
  • Organize reading lists, lecture notes and multimedia resources in one centralized mind map
  • Use color coding and icons to highlight priority topics, prerequisites and cross-course connections

Interactive teaching & student engagement

  • Present complex theories as visual maps during lectures to help students see relationships between concepts
  • Use mind maps as discussion starters and let students contribute branches in real time
  • Create study guides for exam preparation with key concepts and connections clearly marked
  • Transform traditional slide presentations into interactive mind map presentations that encourage exploration

Research & academic writing

  • Map dissertation structures, chapter outlines and argument flows before writing begins
  • Organize literature reviews by theme, methodology or theoretical framework to identify gaps and patterns
  • Visualize research data connections and hypothesis relationships for grant proposals and publications
  • Export maps to Word or PDF for integration into academic papers and research reports

Project & department management

  • Plan department initiatives, accreditation processes and strategic goals with Gantt chart views
  • Create WBS charts for multi-phase research projects or curriculum redesigns
  • Track faculty responsibilities, committee assignments and deadlines in visual project maps
  • Share maps with colleagues for collaborative planning and feedback on departmental initiatives
iMindQ visual mapping workspace

Licensing for educators and institutions

Contact the iMindQ team to discuss options for an individual professor, a department or a university-wide rollout.

Contact Sales Team

Features built for educators

Use the map type and output that best fits each teaching, planning or research task.

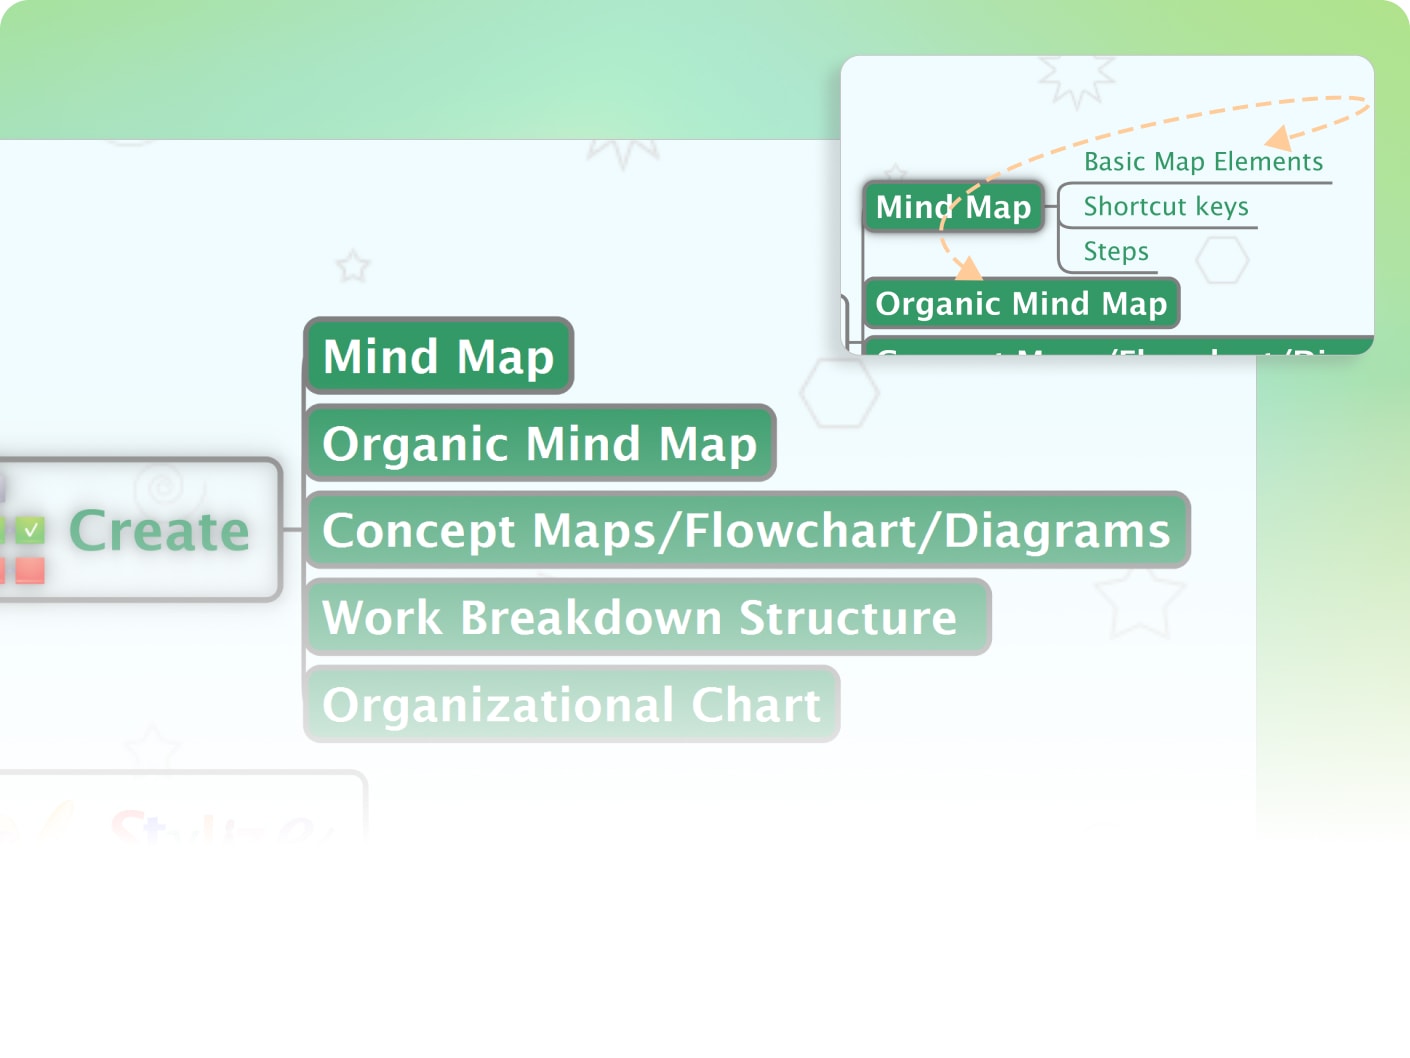
Multiple map typesCreate mind maps, concept maps, flowcharts and WBS charts.
Microsoft Office integrationMove content between iMindQ and Word, PowerPoint, Excel or Project.
Education templatesStart with templates for lesson plans, course outlines, research proposals and presentation structures.
Research panelSearch academic databases and web sources directly within iMindQ while building literature review maps.
AI Research AssistantGenerate ideas, perform quick research, summarize information and accelerate brainstorming directly within iMindQ.
Presentation modeConvert a mind map into a presentation for classroom lectures or conference talks.
Customization optionsChange backgrounds, colors, patterns and text formats to match course branding or institutional style.
Notes & attachmentsAdd detailed notes, hyperlinks, images, icons and file attachments to any topic.

Ready to bring visual thinking into your teaching?

Start a free trial and explore a clearer way to plan courses, explain ideas and organize research.

Try iMindQ Free