![]()
Next
|
|
|
|
|
Next |
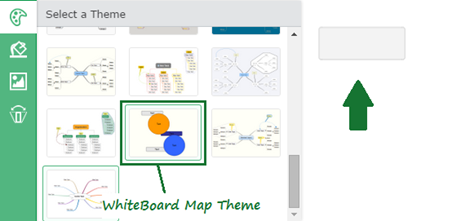
CREATE A FLOWCHART DIAGRAMA flowchart is a type of diagram that represents an algorithm or process, showing the steps as boxes of various kinds, and their order by connecting them with arrows. This diagrammatic representation illustrates a solution to a given problem. Process operations are represented in these boxes, and arrows; rather, they are implied by the sequencing of operations. Flowcharts are used in analyzing, designing, documenting or managing a process or program in various fields. Flowcharts are used in designing and documenting complex processes or programs. Like other types of diagrams, they help visualize what is going on and thereby help the viewer to understand a process, and perhaps also find flaws, bottlenecks, and other less-obvious features within it. There are many different types of flowcharts, and each type has its own repertoire of boxes and notational conventions. As a rule of thumb, flowcharts always start either from left to right or top to bottom. The reason for this is clarity. iMindQ® allows you to create flowchart diagrams very easy. For a faster creation of a Concept Map, you can use the Whiteboard Map theme. To apply this Map Theme, do the following steps:
The reason why we recommend this style, is that the relationships and floating topics have a style predefined for a Flowchart diagrams and Concept Map.
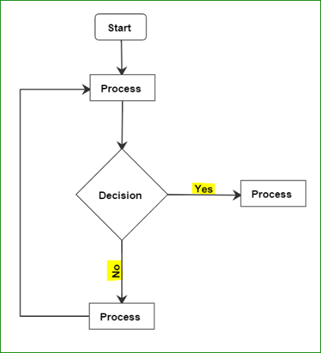
The commonly used notations in a flowchart diagrams are represented on the figure below.
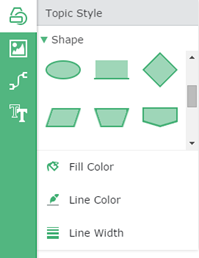
To insert a shape in the map space, double-click in empty map space, to create a floating topic. To change the shape of the topic, do the following steps:
To connect two shapes you can use the Topic menu, like in the figure below. You can put a label to the relationship as well.
To add a label to a relationship, just select the relationship and start directly typing the desired phrase. You can also add a label, by double clicking on the relationship.
|